In today’s tight-margin food industry, companies rarely suffer from a lack of data—they suffer from a lack of clarity. We unify scattered data across your systems (ERP, PLM, PIM) and bills of materials (BOM) into 5 interactive, visual dashboards. In a single glance, you gain instant decision intelligence on which products build your bottom line and which ones drain factory capacity.
Rather than complex consulting projects, we deploy 5 interconnected visual modules with synchronized cross-filtering across brands, product categories, packaging types, and time periods.
The 5 Smart Dashboards
Our visual portfolio suite transforms complex data into clear strategic direction:
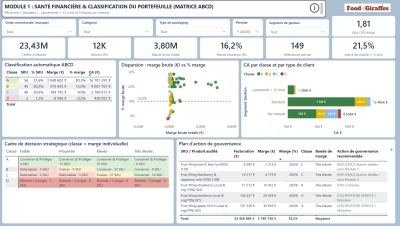
Module 1: Financial Health (ABCD Matrix)
Purpose: Uncover real product profitability.
How It Works: Automatically classifies your entire catalog into an ABCD matrix based on gross margin and commercial contribution.
Key Insight: Pinpoints which SKUs fund the business and outputs actionable decisions per product: Grow, Re-price, or Rationalize/Discontinue
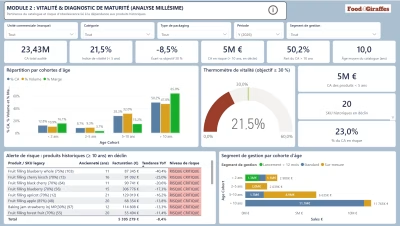
Module 2: Portfolio Vitality & Maturity
Purpose: Measure portfolio renewal rates and age health.
How It Works: Tracks the margin contribution of recent launches versus legacy products in decline (targeting a vitality index ≥ 30%).
Key Insight: Alerts leadership when margin heavily relies on recipes developed 10+ years ago without adequate innovation turnover
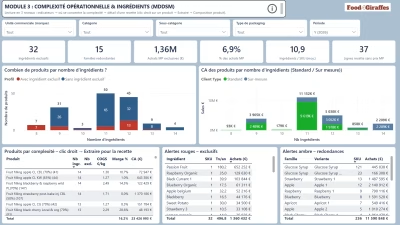
Module 3: Formulation & Ingredient Complexity
Purpose: Eliminate hidden factory complexity and BOM redundancy.
How It Works: Scans ingredient overlaps across recipes, allowing a right-click extraction of the exact product composition.
Key Insight: Highlights exclusive ingredients or packaging used for only a single SKU, streamlining purchasing and reducing plant downtime.
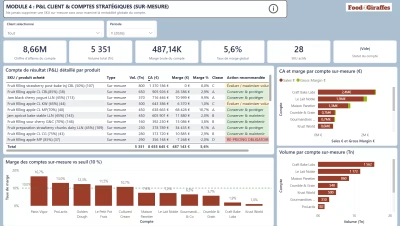
Module 4: Strategic Accounts & Custom Clients
Purpose: Ensure profitability across custom products and private label (MDD) accounts.
How It Works: Builds a true client-level P&L and renegotiation framework.
Key Insight: Provides hard evidence for sales negotiations to guarantee custom formulations remain profitable post-production
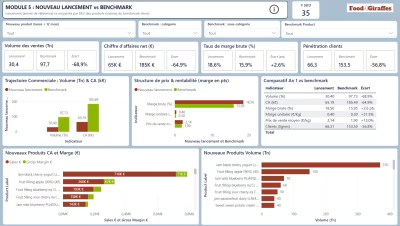
Module 5: Innovation Track Record (New Product Rollouts)
Purpose: Validate new product performance against benchmarks.
How It Works: Benchmark-matches current-year launches against established core products.
Key Insight: Determines whether a new launch is creating net value or simply eating up line capacity without covering costs
Deliverables 🦒
5 Interactive & Operational Dashboards
A complete visual dashboard suite integrating all your product portfolio data (Financial Health, Portfolio Vitality, Recipe Complexity, Strategic Accounts, and New Launches).
Fully interactive and operational tools designed for real-time decision-making, filtering, and cross-departmental alignment.
Product Portfolio Improvement Recommendations
Tailored strategic recommendations and actionable guidelines on how to optimize and improve your product portfolio.
Concrete action plans to increase profitability, remove or re-price underperforming SKUs, and reduce recipe complexity.